Jyväskylä, Building by Building — An Interactive 3D Map of a Whole City
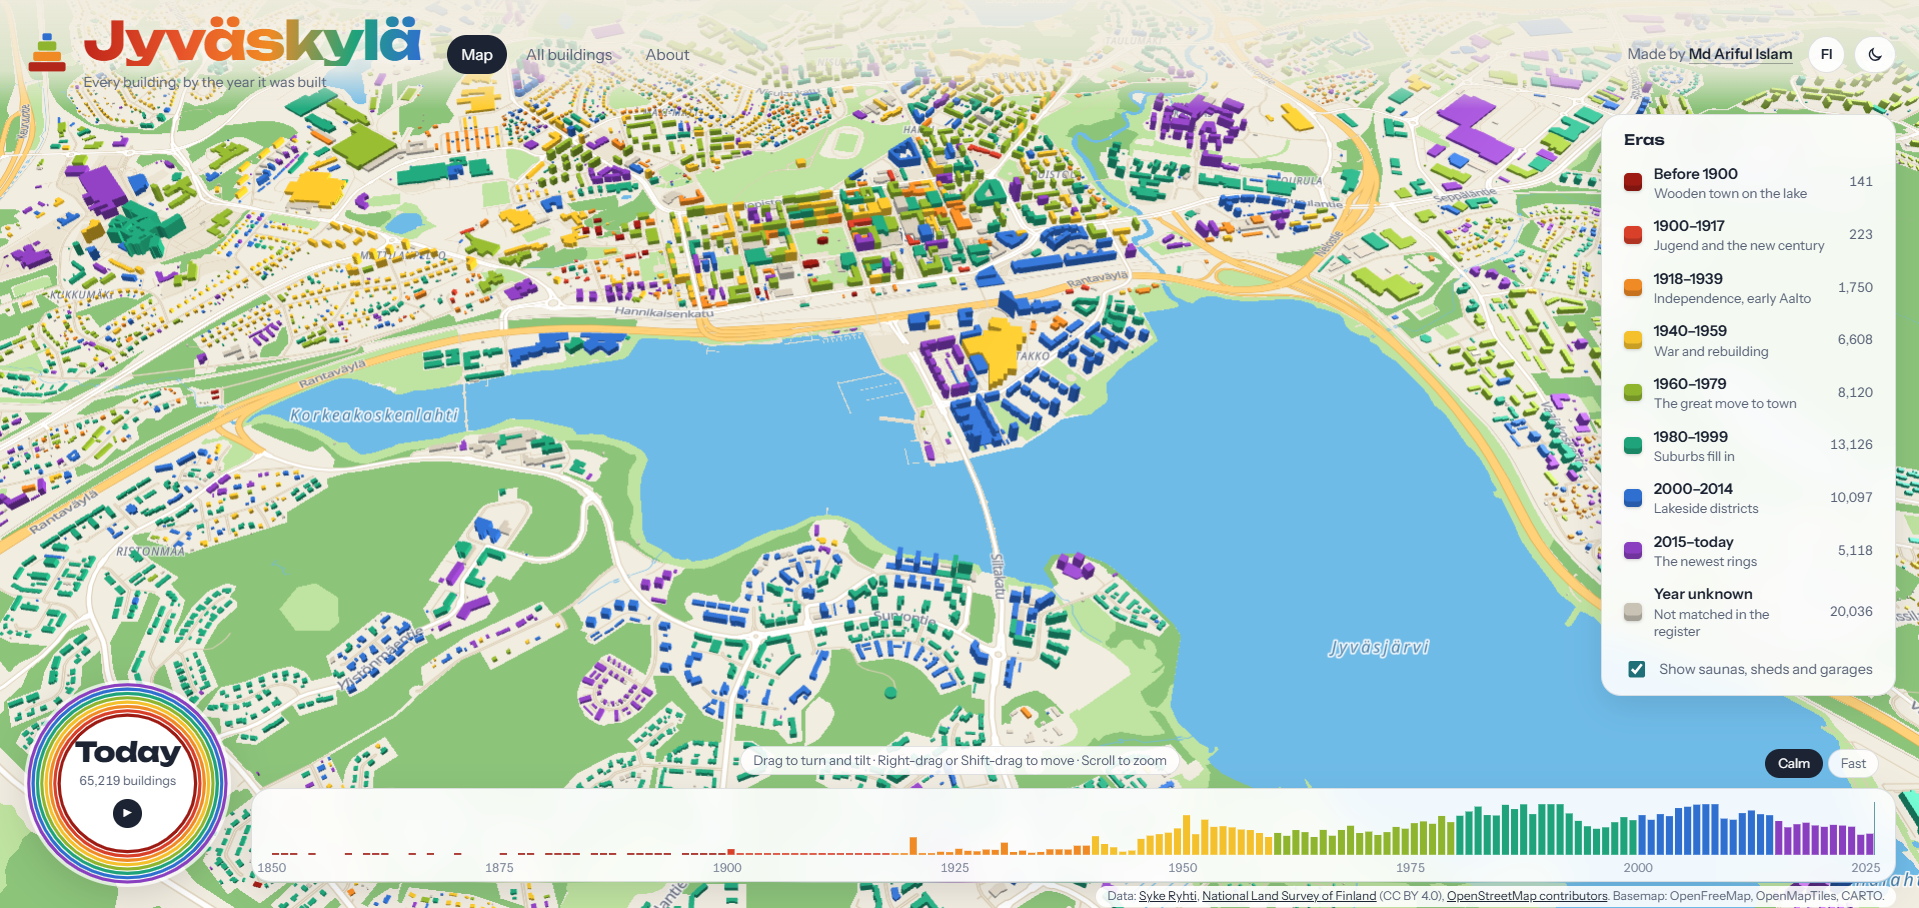
An interactive 3D map of every building in Jyväskylä, Finland — about 65,000 buildings joined from two open government registers, colour-coded by construction era, with a film that shows the city growing from the 1850s to today.
Repo: github.com/Ariful-tushar/jyvaskyla-buildings Role: Solo developer (data pipeline, enrichment, and 3D web app) Type: Personal data/geospatial project — open government data, visualized
Overview
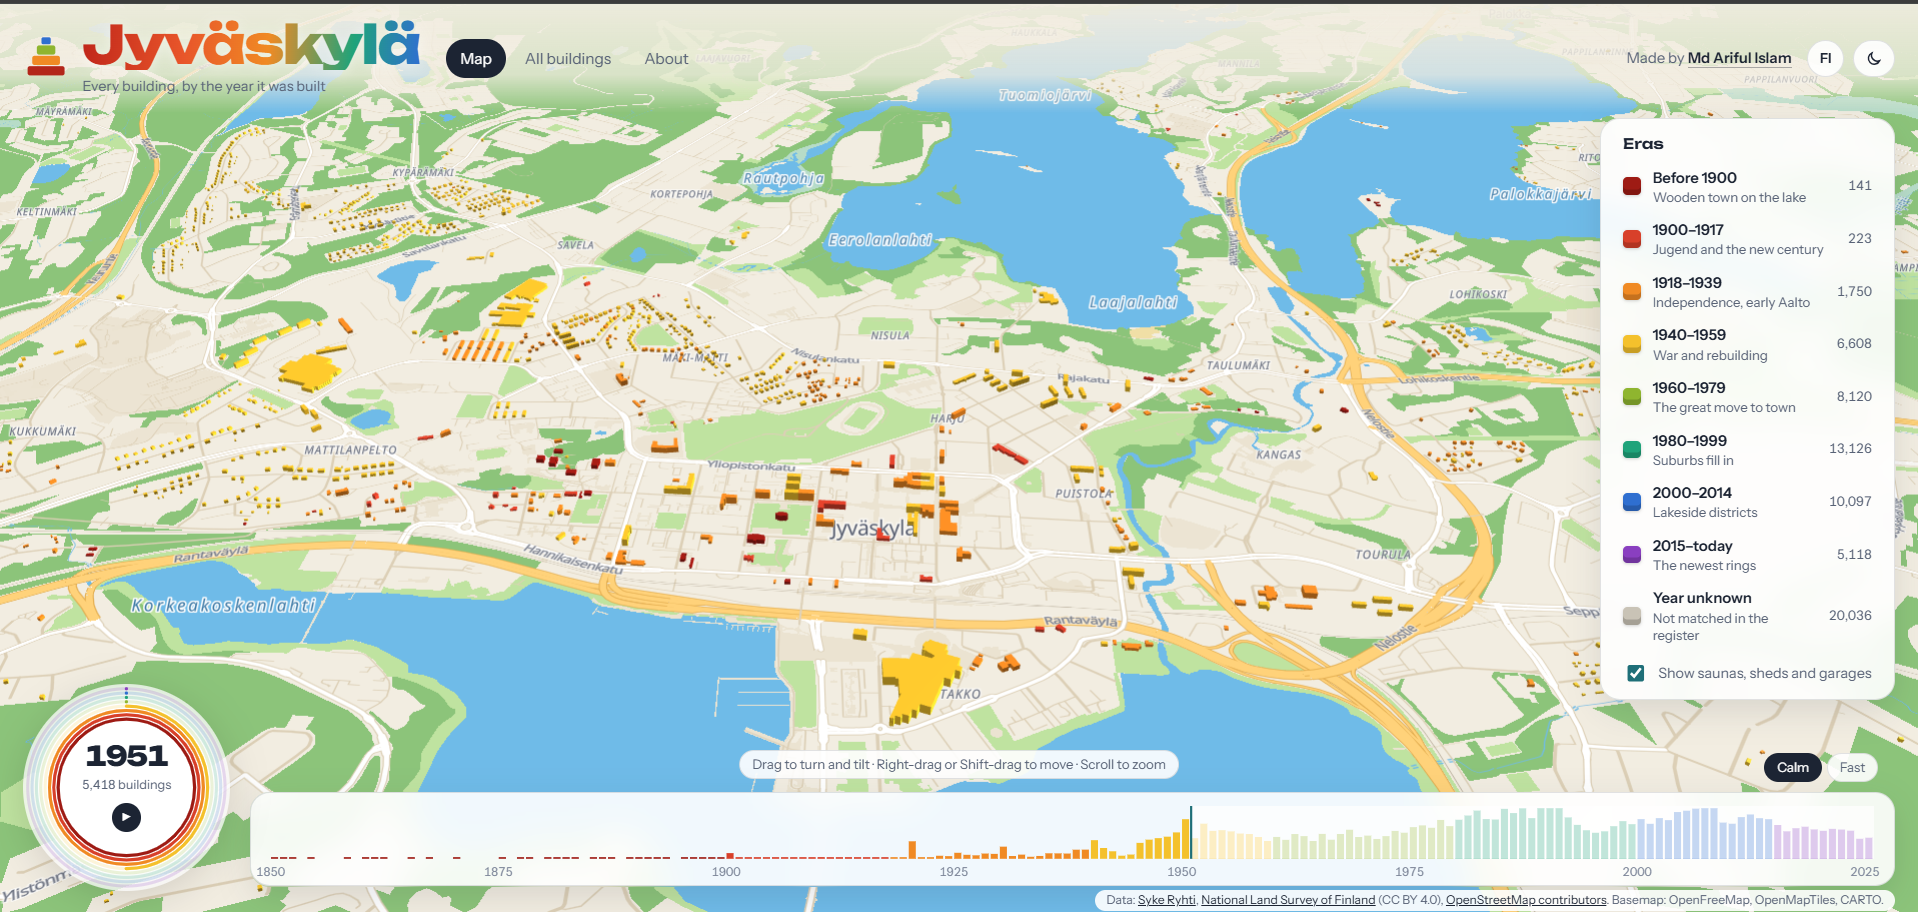
This project draws every building in Jyväskylä, Finland — about 65,000 of them — in 3D in the browser, coloured by the year each one was built: deep red for the wooden town before 1900, through orange, yellow and green, to blue and purple for the newest districts. Press play and the camera flies out over the whole city while every building rains down onto the map in the year it was finished, from the 1850s to today.
The hard part isn't the visuals — it's the data. The city's building years, addresses, and construction details live in one government register (Ryhti, from the Finnish Environment Institute); the building outlines live in a completely different one (the National Land Survey's Topographic Database), and the two share no common ID. Joining them means matching ~65,000 geometric outlines to register points purely by location, resolving the cases where several registered buildings share one outline, and handling inconsistent date formats along the way.
Key Features
- Every building in 3D, coloured by construction era, rendered with deck.gl's WebGL pipeline on top of a MapLibre GL base map.
- A growth film — the camera flies out over the city while each building falls into place in its construction year; a timeline below counts buildings finished per year. The animation (including the per-building "rain" and hover-lift effects) runs in a custom GLSL shader so it stays smooth with all 65,000 buildings on screen at once.
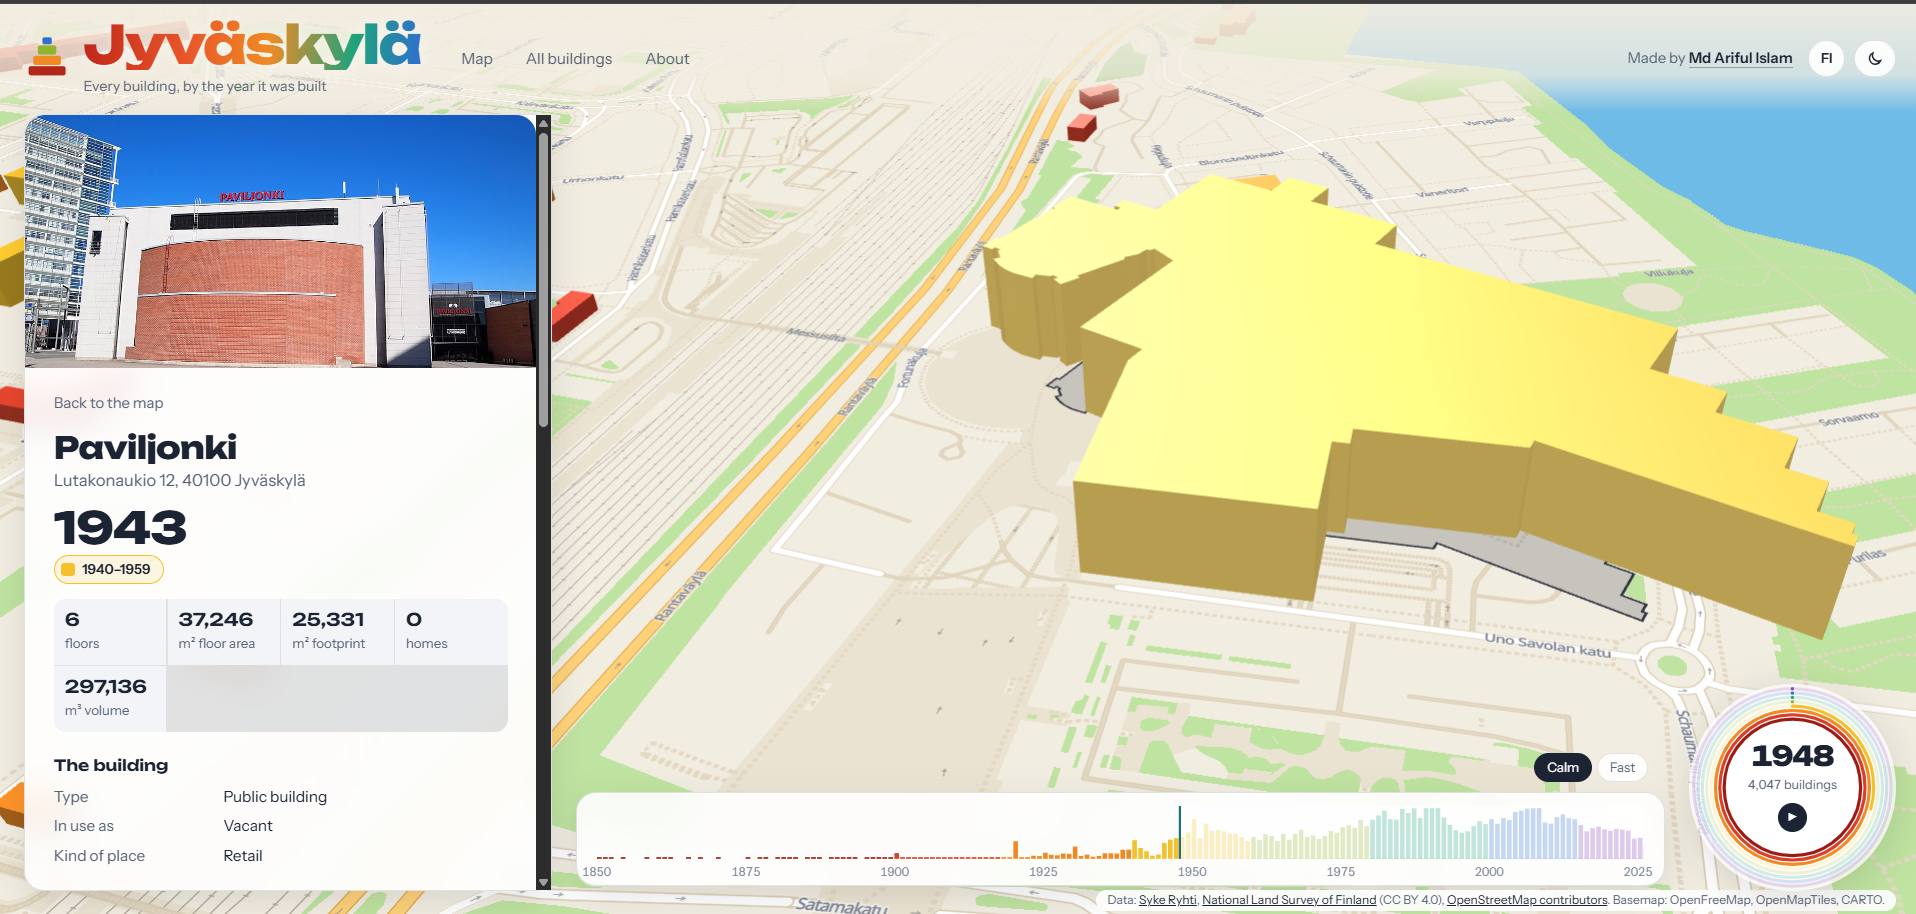
- Click any building to open its own page: address, name, year, floors, floor area, homes, structure, facade, heating, energy source, heritage protection status, what's inside (shops, cafés, schools, pulled from OpenStreetMap), a footprint drawing, a photo when one exists, and links to street-level photos.
- An all-buildings list at
/all-buildings— searchable by street, name, or building ID, sortable by age/size/height, filterable by era, paginated. - A shareable page per building at
/details_building-<id>. - Full 3D map controls — drag to rotate and tilt from top-down to near ground-level, right-drag/Shift-drag to pan, scroll to zoom.
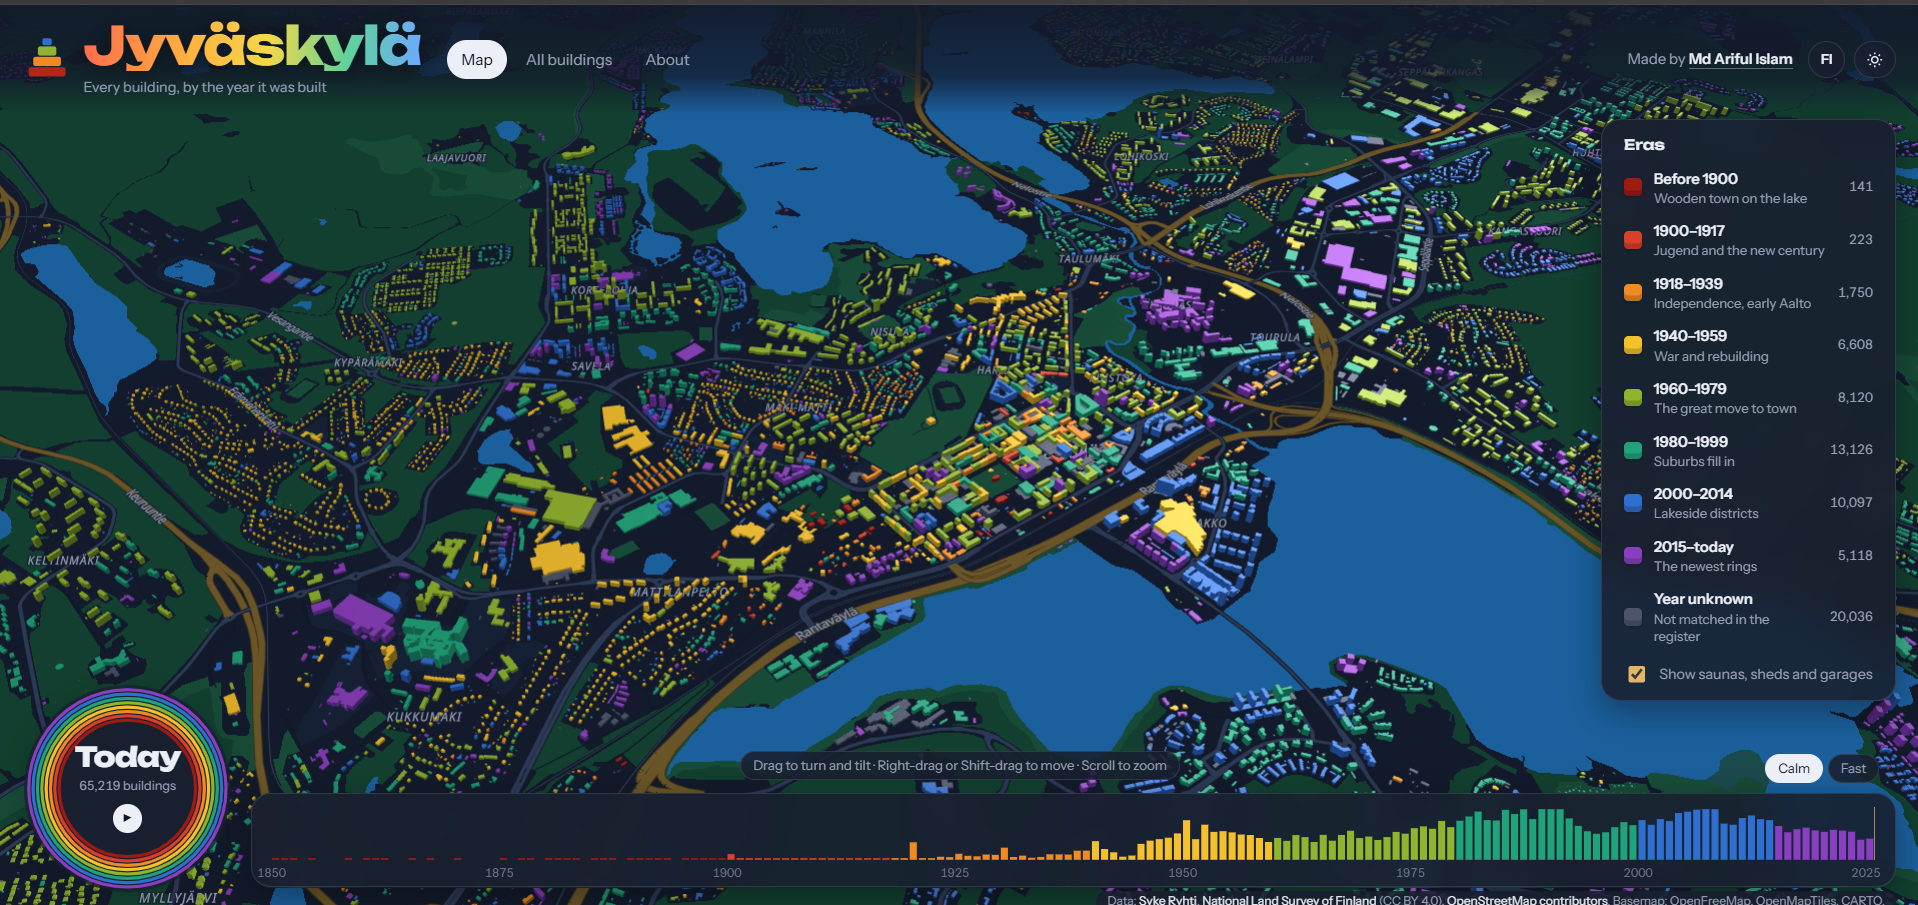
- Light/dark themes and full English/Finnish bilingual support throughout.
How It Works
- Join two registers that share no ID.
combine_buildings.pystreams the ~2GB Ryhti CSV in chunks, filters to the Jyväskylä area, and spatially matches each register point to the building outline it falls inside (or the nearest one within 10m). Where several registered buildings share one outline, the largest is kept and the rest are counted. Dates in three different formats are all parsed, and 1 January dates are flagged as likely estimates rather than trusted as exact. - Enrich.
enrich_buildings.pyadds street addresses from Ryhti's open address data, building names and points of interest from OpenStreetMap's Overpass API, and converts Ryhti's coded values into readable English/Finnish labels using Finland's national code lists — caching everything it downloads so repeat runs are fast. - Prepare for the web.
prepare_web_data.pysimplifies the outlines, reprojects them to longitude/latitude, and writes two files: a light one the map needs immediately (outline, year, height) and a larger one with click-through details that loads in the background so the map appears quickly. - Draw it.
web/index.htmlis a single page with no build step: MapLibre GL draws the base map, deck.gl extrudes and colours 65,000 buildings, and a custom GLSL shader extension drives the rain animation and hover/selection effects directly on the GPU.
Tech Stack & Skills Demonstrated
Geospatial data pipeline Python · GeoPandas · Shapely · pandas · spatial joins in the Finnish national grid (EPSG:3067) · chunked processing of a multi-gigabyte CSV
Open data integration Syke Ryhti OGC API Features · OpenStreetMap Overpass API · Finnish national code lists (koodistot.suomi.fi) · Wikimedia Commons/Wikidata for building photos
3D web rendering MapLibre GL JS · deck.gl · custom GLSL shader programming for GPU-driven animation · plain HTML/CSS/JavaScript with no build tooling
Engineering practice Designing a two-file data format (light outlines vs. heavy details) to keep first paint fast at 65k-feature scale · bilingual (EN/FI) UI from the ground up · a static deploy that works whether served from a domain root or a subpath
Project Structure
jyvaskyla-buildings/
├── combine_buildings.py      # Step 1: join the Ryhti register to NLS outlines by location
├── enrich_buildings.py       # Step 2: addresses, OSM names, EN/FI labels
├── prepare_web_data.py       # Step 3: write buildings.geojson + buildings_details.json
├── make_deploy.py            # Package the static site for hosting
├── buildings.geojson         # Prepared data: outlines, year, height (drawn on the map)
├── buildings_details.json    # Prepared data: per-building details shown on click
├── web/
│   ├── index.html            # The whole web app — map, film, list, building pages, EN/FI, themes
│   ├── serve.py               # Local dev server with page-path support
│   └── _redirects
└── requirements.txt
The Data in Numbers
| Building outlines | 65,219 |
| Outlines matched to the register | 45,780 |
| Buildings with a construction year | 45,183 (69%) |
| Buildings with no year (mostly outbuildings) | 20,036 |
Data Sources & Credits
- Construction years, addresses, and building details: Ryhti building register, Finnish Environment Institute (Syke)
- Building outlines: National Land Survey of Finland, Topographic Database (CC BY 4.0)
- Building names and points of interest: © OpenStreetMap contributors (ODbL)
- Photos: Wikimedia Commons, via Wikidata
- Base map: OpenFreeMap, © OpenMapTiles, © OpenStreetMap contributors
- Idea inspired by LAYRS Amsterdam, a map of every building in Amsterdam by age
Impact
- Turns two large, incompatible government datasets with no shared key into a single, explorable map — the kind of "the IDs don't match" integration problem that shows up constantly in real data work, solved here with a location-based spatial join instead of assuming a clean key will exist.
- Renders 65,000 extruded 3D buildings with a smooth, continuous growth animation by moving the per-building animation logic into a custom GPU shader rather than driving it from JavaScript — a concrete example of finding the right layer to solve a performance problem.
- Fully bilingual (English/Finnish) and accessible from a shareable URL per building, not just a single opaque map view.